Everyone planning to retire in India obsesses over the number. Is it ₹5 crore, ₹10 crore, ₹40 crore? You hit it, a calculator tells you the money lasts forever, and you feel safe. I want to show you why that feeling is dangerous, so I took a ₹10 crore retirement and ran it through my own sequence risk calculator, in rupees, and then I did the one thing those comfortable projections never do. I broke it on purpose.
What follows is the whole experiment, screenshot by screenshot. We start with the plan that looks perfect, we add a sensible safety buffer, and then we drop in a market crash and watch what happens when it lands early instead of late. The ending genuinely surprised me, and it is the single most important thing to understand before you retire on any number.
Step 1: the averages say you get rich
Here is the starting point. You retire with ₹10 crore. You follow the standard rule and withdraw 3% in year one, which is ₹30 lakh, and you raise that spending every year with inflation, which for India I have set to a realistic 6%. Your money is invested for the long run and earns an average of about 11% a year, roughly what Indian equity has delivered. Across a 40 year retirement, here is what the average says.
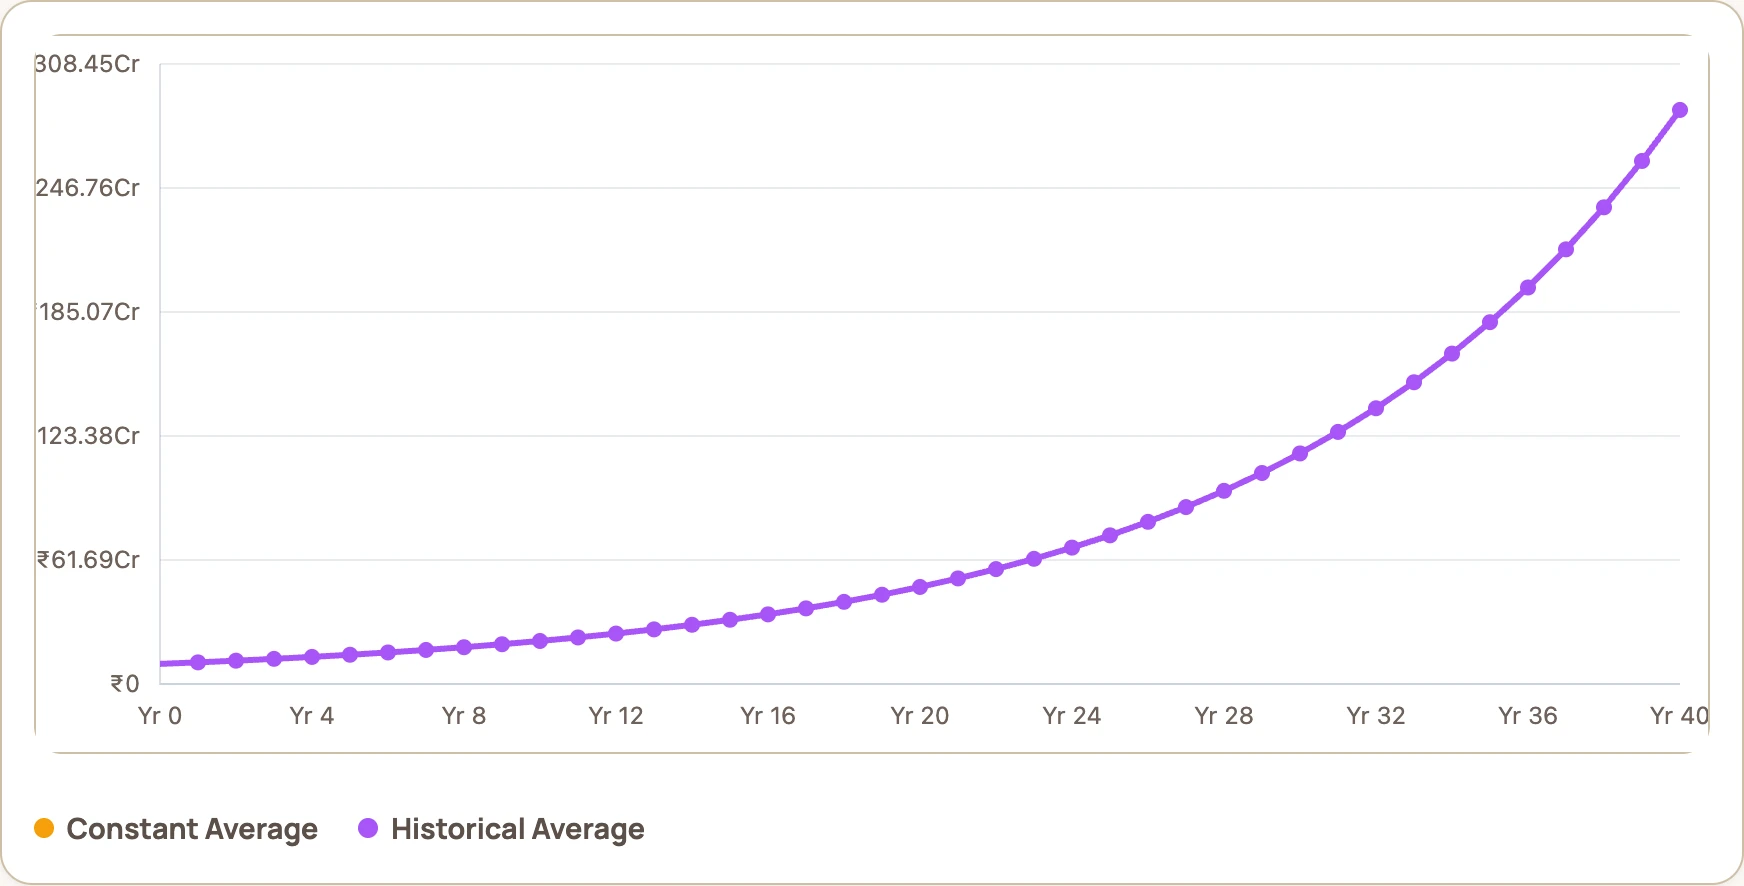
₹10 crore at a 3% withdrawal, growing at an average 11% against 6% inflation. The calculator says Safe, and the portfolio climbs to about ₹285 crore.
This is the projection that makes people comfortable. It does not just say you survive, it says you end up with 28 times what you started with. On the strength of a chart like this, most people would retire without a second thought. The problem is that this smooth line is a fantasy, and I am going to show you exactly why.
Step 2: you are smart, so you build in a buffer
You have read enough to know that 3% might be aggressive for a very long retirement, so you do the responsible thing and cut your withdrawal to 2.5%, which is ₹25 lakh a year. A bigger cushion, more margin for error. Good instinct.
But averages hide a slow leak, and it has nothing to do with a crash. Watch what happens if the market simply does nothing for a while, a flat 0% return, while your spending keeps climbing with 6% inflation.
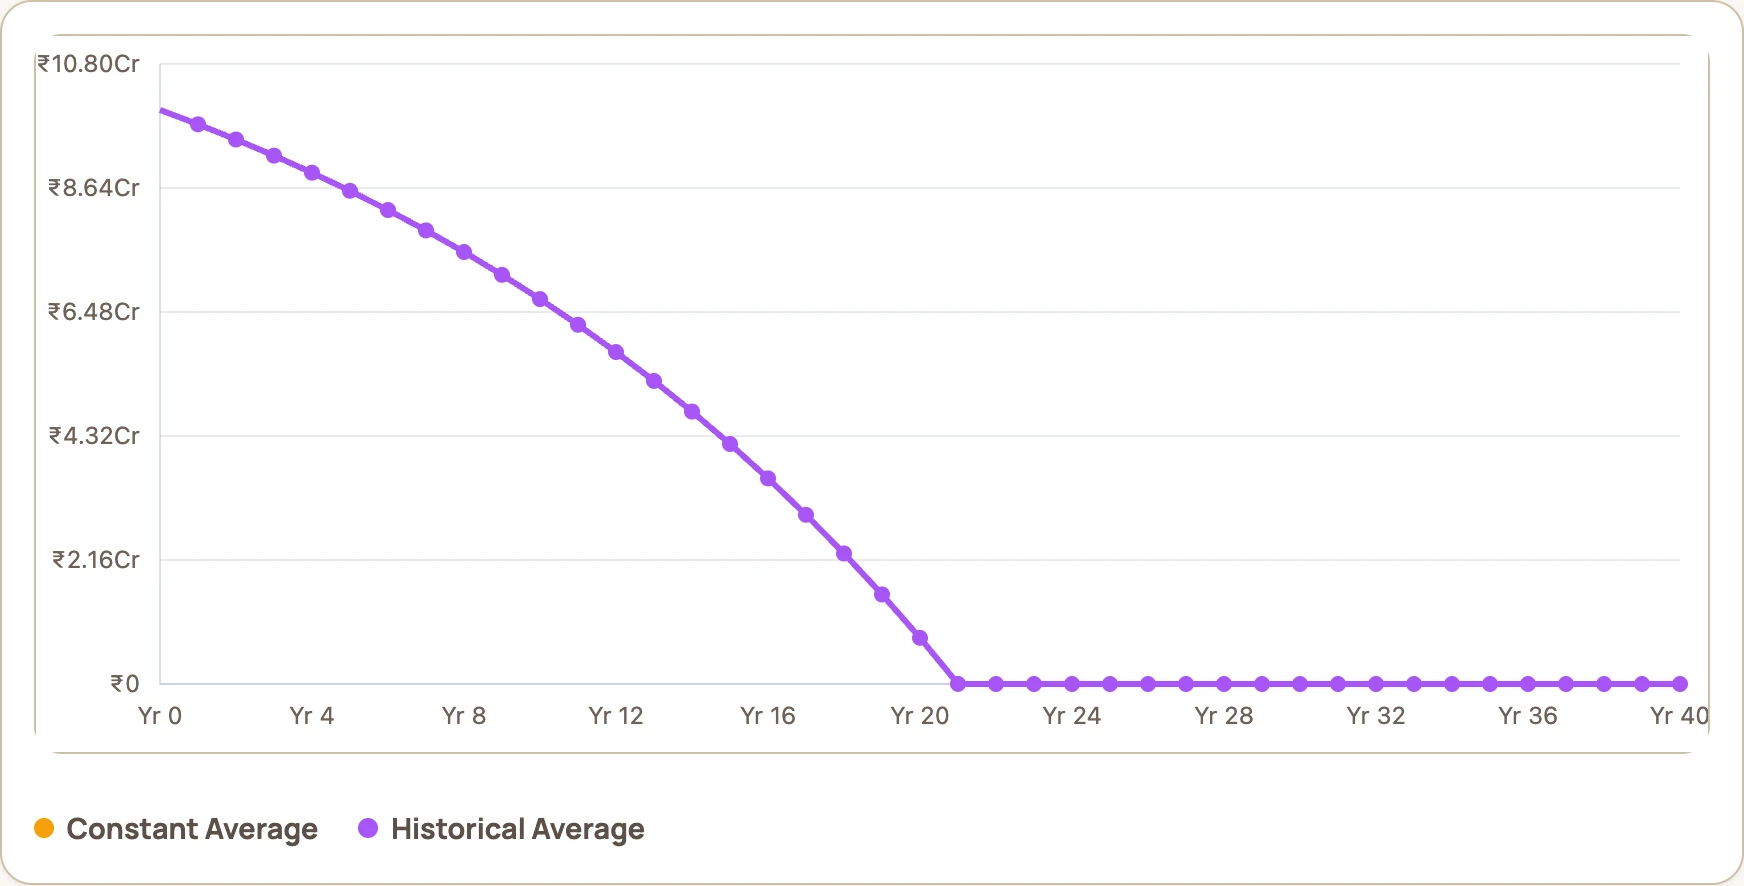
The same ₹10 crore at 2.5%, with a flat market and 6% inflation. The portfolio bleeds down every year while the withdrawal keeps growing.
Your careful 2.5% does not stay 2.5%. Your spending rises with inflation while the portfolio shrinks, so your real withdrawal rate creeps up on its own. By year 4 of a flat market, that safe 2.5% has already become 3.2%. By year 8 it is close to 4.8%. You did nothing wrong, the market just failed to help, and your buffer quietly evaporated. In India, where inflation runs higher than in the West, this leak is faster and more punishing than almost anyone plans for.
Step 3: now the market actually crashes
So far nothing has crashed. Let us fix that. Imagine the AI boom that is inflating markets right now finally bursts, and it looks a lot like the dot com crash of 2000, which fell roughly 9%, then 12%, then 22% across three straight years. Now imagine it lands in the first years of your retirement, while you are calmly withdrawing your ₹25 lakh a year.
I injected exactly that sequence into the calculator, starting in year 1.
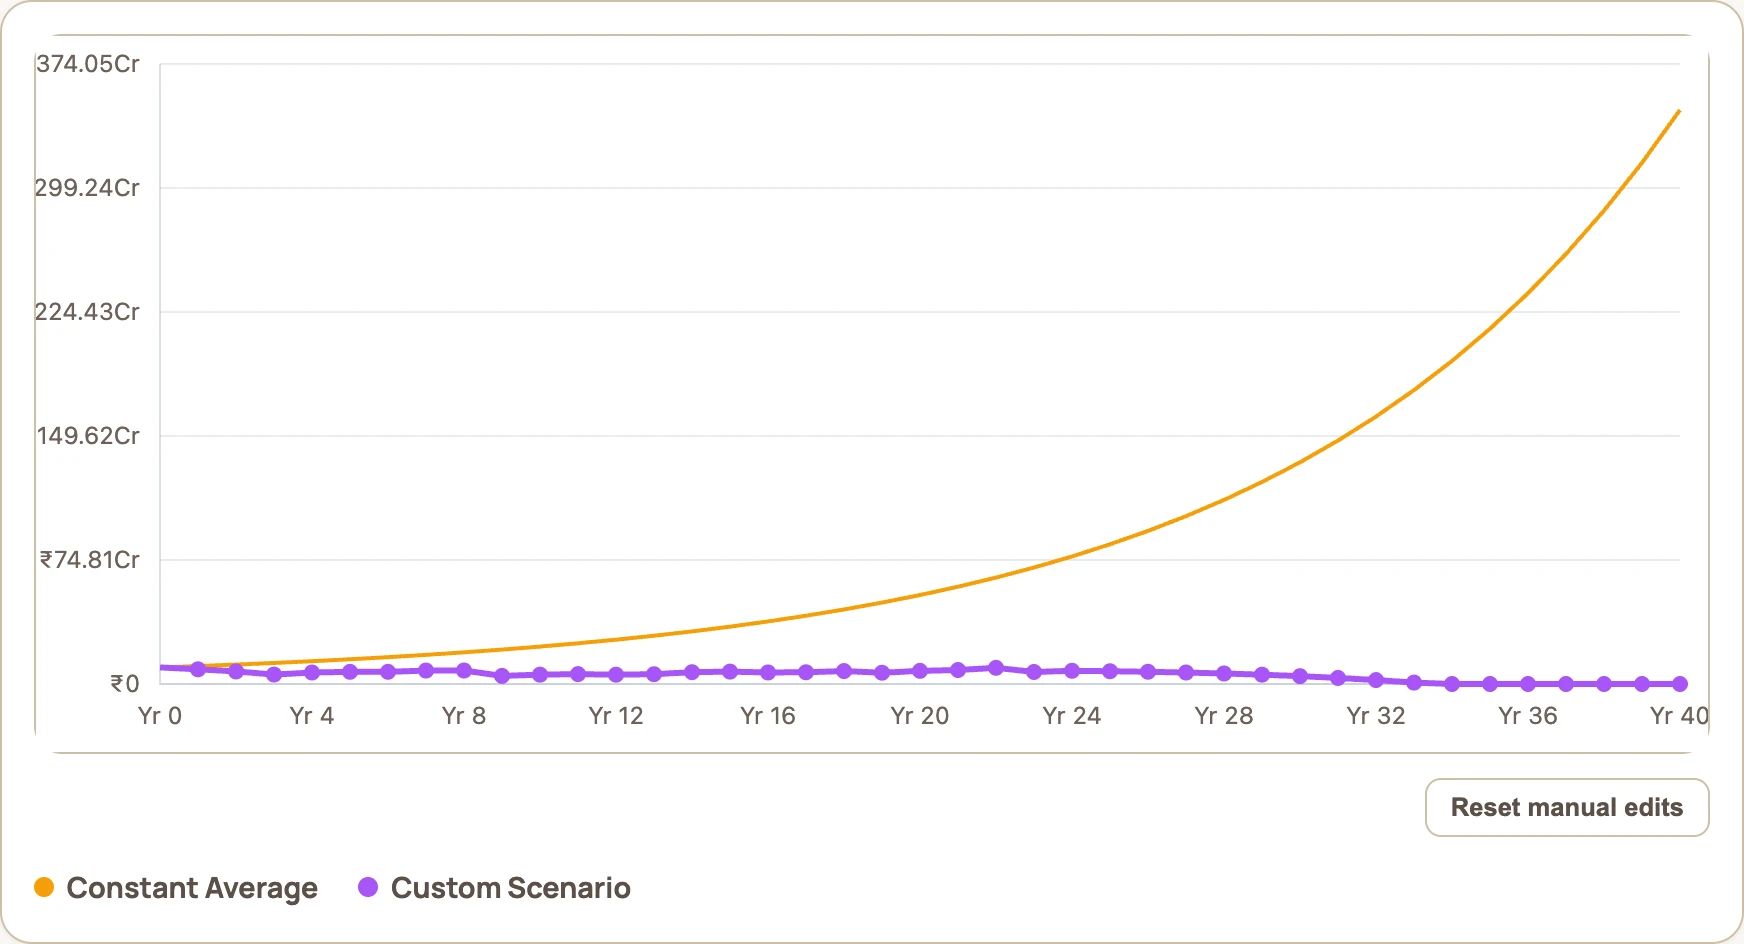
The same 2.5% plan, with a dot com style crash in the opening years. The orange line is the average fantasy climbing to ₹346 crore. The purple line is your actual money, and it dies.
Look at the gap between the two lines, because that gap is the entire point of retirement planning. The average promised ₹346 crore. Your real portfolio, forced to sell shares while the market was down just to fund your life, never recovers and reaches zero. Same ₹10 crore, same 2.5% withdrawal, same long run 11% average. One badly timed crash is the difference between generational wealth and running out of money. This is sequence of returns risk, and it is the risk that almost no Indian retirement plan accounts for.
Step 4: the same crash, a few years later
Here is where it stops being scary and starts being useful, because I changed exactly one thing. I kept the same crash, the same money, the same everything, and I only moved when the crash hits. I shifted it 2 years later, then 4, then 6.
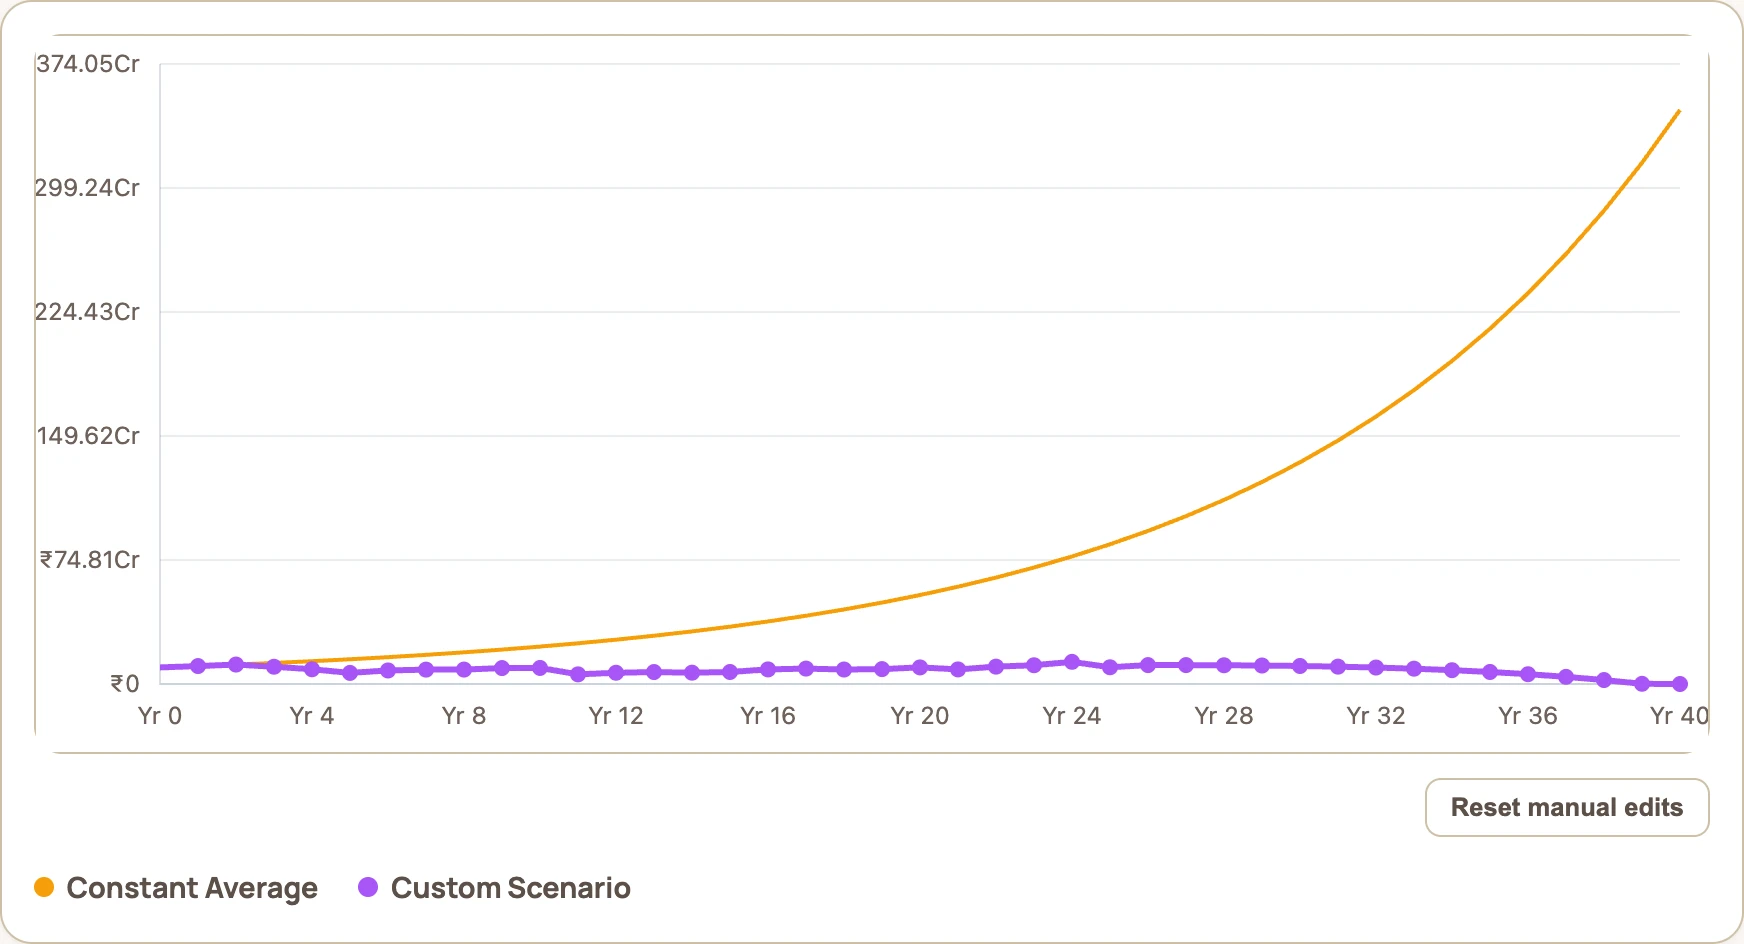
The crash shifted to year 3. Still not enough runway. The plan still fails to zero.
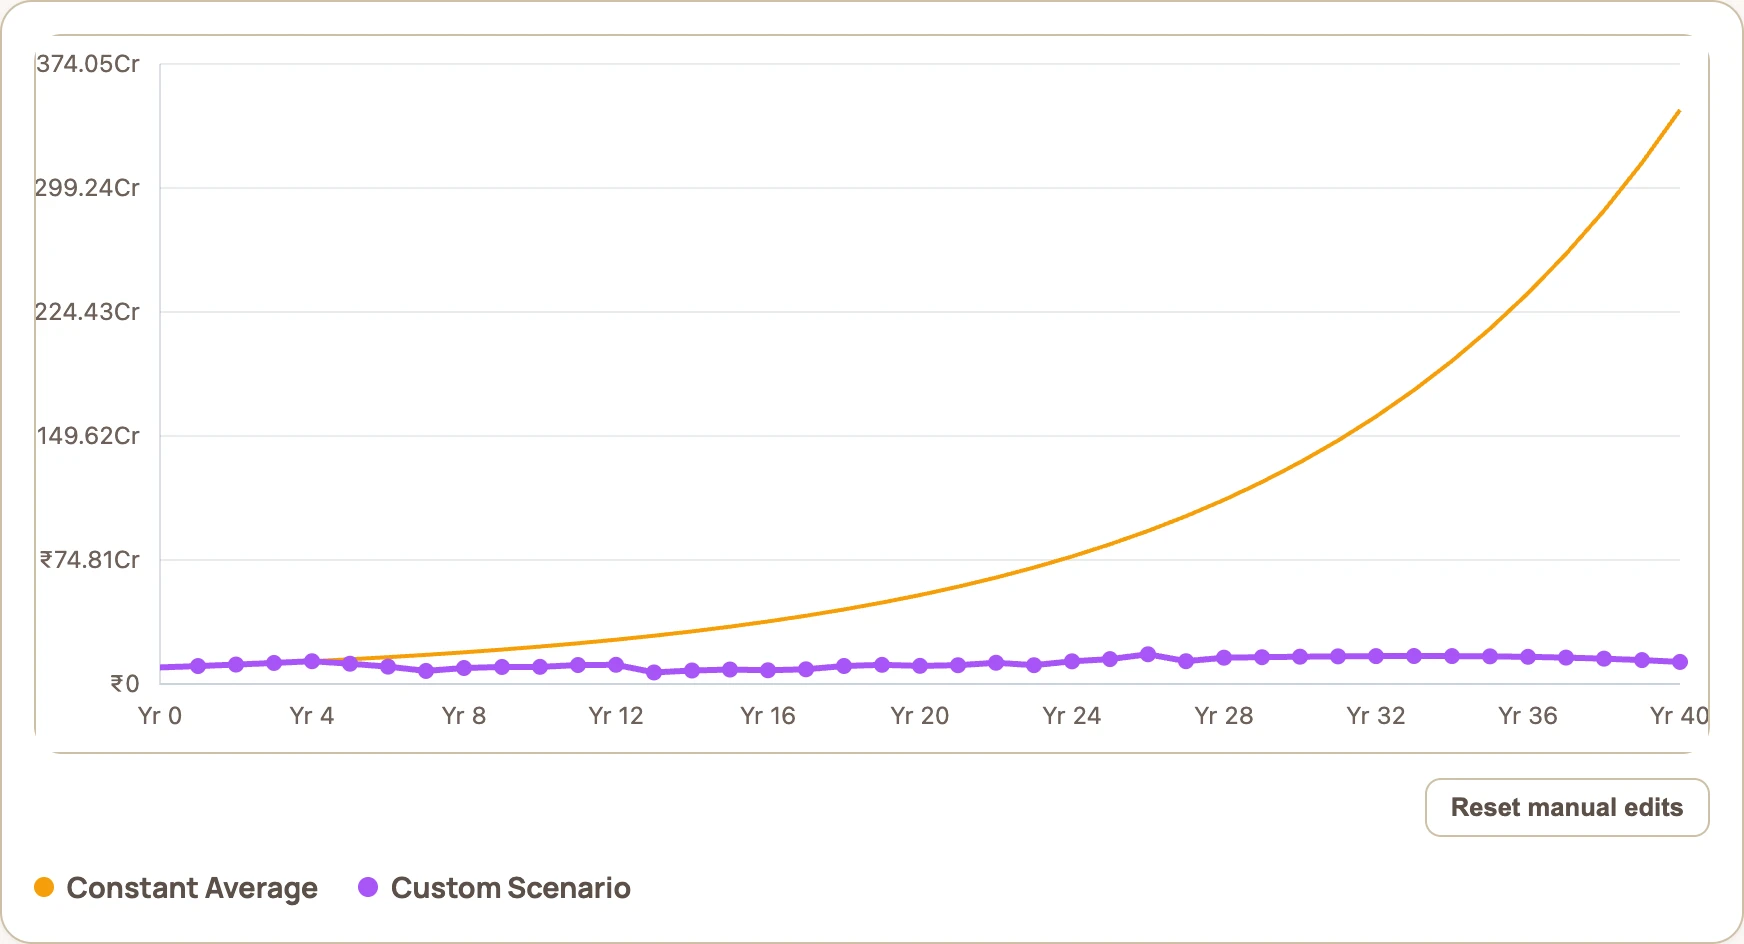
The crash shifted to year 5. Now it survives, ending with ₹13.31 crore.
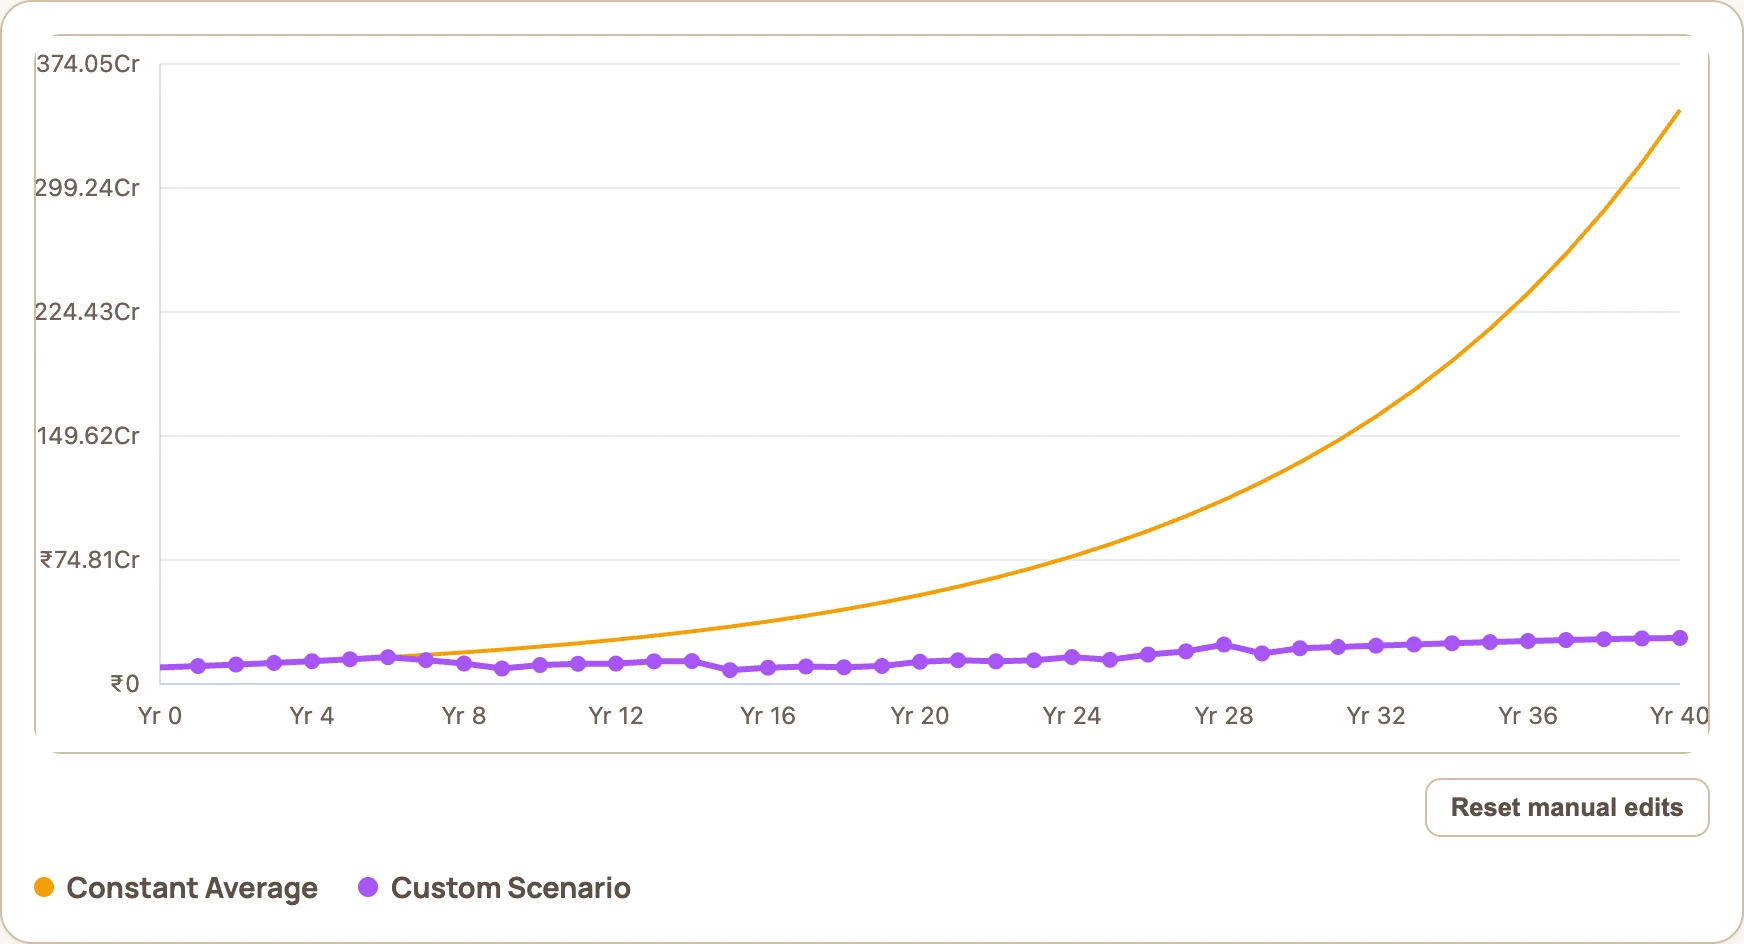
The crash shifted to year 7. It survives comfortably, ending with ₹27.80 crore.
Read that again, because it is astonishing. The exact same crash, hitting the exact same plan, produces this.
| When the crash hits | Outcome | Money left after 40 years |
|---|---|---|
| Year 1 | Plan fails | ₹0 |
| Year 3 | Plan fails | ₹0 |
| Year 5 | Survives | ₹13.31 crore |
| Year 7 | Survives | ₹27.80 crore |
Nothing changed except the calendar. A crash in your first few years leaves you with nothing, and the identical crash a few years later leaves you with 13 to 28 crore. Your portfolio just needed a little time to grow before it took the hit, so it could absorb the fall without you being forced to sell everything at the bottom. The first four or five years of your retirement are worth more than every year that comes after them put together.
What this actually teaches you
A handful of lessons fall out of this, and they matter far more than the size of your number.
The averages are a story, not a plan. Nobody earns the average every year. You earn a sequence, one real year after another, and the order they arrive in decides your whole outcome. A calculator that only shows you the smooth average line is lying to you by leaving the sequence out.
Your withdrawal buffer is thinner than it looks. Indian inflation pushes your withdrawal rate up even when the market does nothing at all, so a 2.5% start can cross 3% in roughly 4 flat years. A low starting rate on its own does not keep you safe.
The early years are the whole game. A crash in year 1 or 3 can end a plan that would otherwise have grown to hundreds of crores, while the very same crash in year 5 or 7 barely dents it. Where you sit in the timeline when the market falls matters more than how far it falls.
So the real protection comes from a plan that survives a bad start, far more than from a bigger number. Keep a few years of spending in cash and safe assets so you never have to sell equity into an early crash, which is the whole idea behind a bucket strategy. Be willing to cut your spending in a bad year, which is what withdrawal guardrails are for. And be very careful about retiring fully invested at the top of a roaring bull market, which is exactly the position a lot of people are in right now.
The best move you can make is to stop trusting the average and stress test your own number against a bad sequence. Run your figures through the sequence risk calculator yourself, switch it to rupees, and drop a crash into your first few years. It is far better to feel this on a screen today than to live it in 2031. If you want the historical version of the same idea, I also backtested a real ₹10 crore retirement across 26 years of actual market data, and if you are still working out your target, start with how many crores you actually need to FIRE in India.
Frequently Asked Questions
What is sequence of returns risk?
It is the danger that a market crash early in retirement, while you are withdrawing money, permanently damages your portfolio. The same average return arriving in a different order can mean the difference between survival and running out of money, because a crash in the first years forces you to sell investments while they are down.
Does a market crash matter more early or late in retirement?
Far more early. In this experiment, the exact same dot com style crash depleted a ₹10 crore plan to zero when it hit in year 1 or year 3, but the identical crash left ₹13.31 crore when it hit in year 5 and ₹27.80 crore when it hit in year 7. Nothing changed except the timing.
Is a 2.5% or 3% withdrawal rate safe for FIRE in India?
Not automatically. Indian inflation of around 6% pushes your effective withdrawal rate up over time, so even a careful 2.5% start crosses 3% within about 4 years if the market stays flat. Real safety comes from a cash cushion and flexible spending, not from a low starting rate alone.
How do you protect a retirement against sequence risk?
Keep a few years of spending in cash and safe assets so you never have to sell equity into an early crash, use flexible withdrawal guardrails that cut spending in bad years, and avoid retiring fully invested at the top of a bull market. You can stress test your own plan against a bad early sequence with the free sequence risk calculator.
The disclaimer, please actually read it
I need to be clear about what this is. This is an experiment I ran in my own calculator to make a point about how retirement money really behaves, and it is general information and honestly a bit of entertainment, nothing more. It is absolutely not financial advice, investment advice, tax advice, or a recommendation to retire on any particular number or withdrawal rate. I am not a licensed financial advisor, a planner, or an accountant, and I know nothing about your income, your family, your health, or your goals, so none of this is tailored to you.
Every number here comes from a simplified model. The 11% average return, the 6% inflation, the 2.5% and 3% withdrawal rates, and the 40 year horizon are all assumptions, and the crash is the historical dot com sequence used as an illustrative shape, not a forecast of any future crash. Real markets, real inflation, taxes, and fees will all behave differently, and a single sequence of returns is one possibility out of thousands, not a prediction. The calculator also ignores taxes, fees, health shocks, and the very human habit of adjusting your spending when things go wrong.
So please do not take these figures and set your own retirement date by them. Treat this as a way to understand sequence risk and why the early years matter, then do your own careful math for your own life, and speak to a qualified financial professional before you act. Your money and your future are entirely your own responsibility, and only you can make these calls.