Every FIRE number you have ever seen is built the same way. You take what you spend in a year, multiply it by 25, and that is the pot you need before you can stop working. My own Lean FIRE number is built exactly like that. It is clean, it is easy to remember, and it comes with the comforting feeling that somebody, somewhere, did the math properly.
Somebody did, but they did it for a different person. 25 times your spending is just the 4% rule turned around, and the 4% rule was worked out for someone retiring at 65 who needed their money to last 30 years. I wrote about the math behind the 4% rule recently, and the uncomfortable part was what happened when the retirement stretched past 30 years. Most people in FIRE stop working in their thirties or forties, which means their money has to last 45, 50 or 55 years, and nobody hands you a separate number for that.
So I took a hypothetical early retiree, put their plan into the FIRE planner I built, and ran it through 1,500 futures built from real stock market years, one step at a time, changing one thing at a time. Here is the short answer before the detail. 25x is enough for a retirement of 30 years or less. For an early retirement it is enough only if a few things are true: you can cut your spending after a bad year, some income arrives later in life, and inflation and stock returns stay close to their long history. Take those away, and 25x at 35 lasted to 90 in only 46 of 100 futures.
In this article I will introduce the person, walk through what the planner says at every step with screenshots, show you exactly which variables move the answer and by how much, and then describe the person for whom 25x is genuinely enough. If that person is you, you can relax. If it is not, you will know what to change.
Meet Sam, a hypothetical early retiree
Sam is 35 and stopping work today. Sam spends $4,000 a month, which is $48,000 a year, and has saved exactly 25 times that, $1.2 million, which is precisely what every FIRE calculator says Sam needs. The money sits 70% in US stocks and 30% in bonds, rebalanced once a year, and Sam has no house, no kids and no pension, so the plan is about as clean as a FIRE plan gets.
| What Sam spends | A month | What kind of cost |
|---|---|---|
| Rent | $1,600 | Essential |
| Food and household | $700 | Essential |
| Health | $400 | Essential |
| Getting around | $250 | Essential |
| Travel | $400 | Discretionary |
| Going out and shopping | $400 | Discretionary |
| Everything else | $250 | Discretionary |
| Total | $4,000 | 74% essential, 26% discretionary |
The planner needs three assumptions, and I left them at its defaults: stocks return 7% a year before inflation, bonds return 4%, and prices rise 3% a year. Those defaults are deliberately cautious. The S&P 500 actually returned 10% a year from 1928 to 2025, but nobody knows whether the next 55 years will match the last 98, and a planner that assumes the best of history is a planner that flatters you. I will show you the answer under both 7% and 10% further down, because that single assumption turns out to be one of the biggest levers in the whole plan.
Step 1: the answer every calculator gives you
Most retirement calculators grow your money at one smooth average return every single year. On Sam's numbers that answer is short and grim, because at 7% for stocks and 4% for bonds, Sam's money runs out at 79. A 70/30 mix at those returns earns a little over 6% a year, which is only about 3% after inflation, and Sam is taking out 4% a year for 55 years. The smooth line simply cannot keep up.
That number is misleading in both directions, because real markets never deliver the average in a straight line. Some decades are far better than the average and some are far worse, and the order they arrive in matters enormously when you are withdrawing money every year. So the planner does something different.
Step 2: 1,500 futures, with spending that never changes
Instead of one smooth line, the planner builds 1,500 possible futures out of real S&P 500 years from 1928 to 2025. It draws them in blocks of 5 years, so that a crash stays together with the recovery that followed it, and then it shifts each future so that it compounds at the 7% Sam assumed. Then it asks the only question that matters, which is how many of those 1,500 futures still have money left at 90.
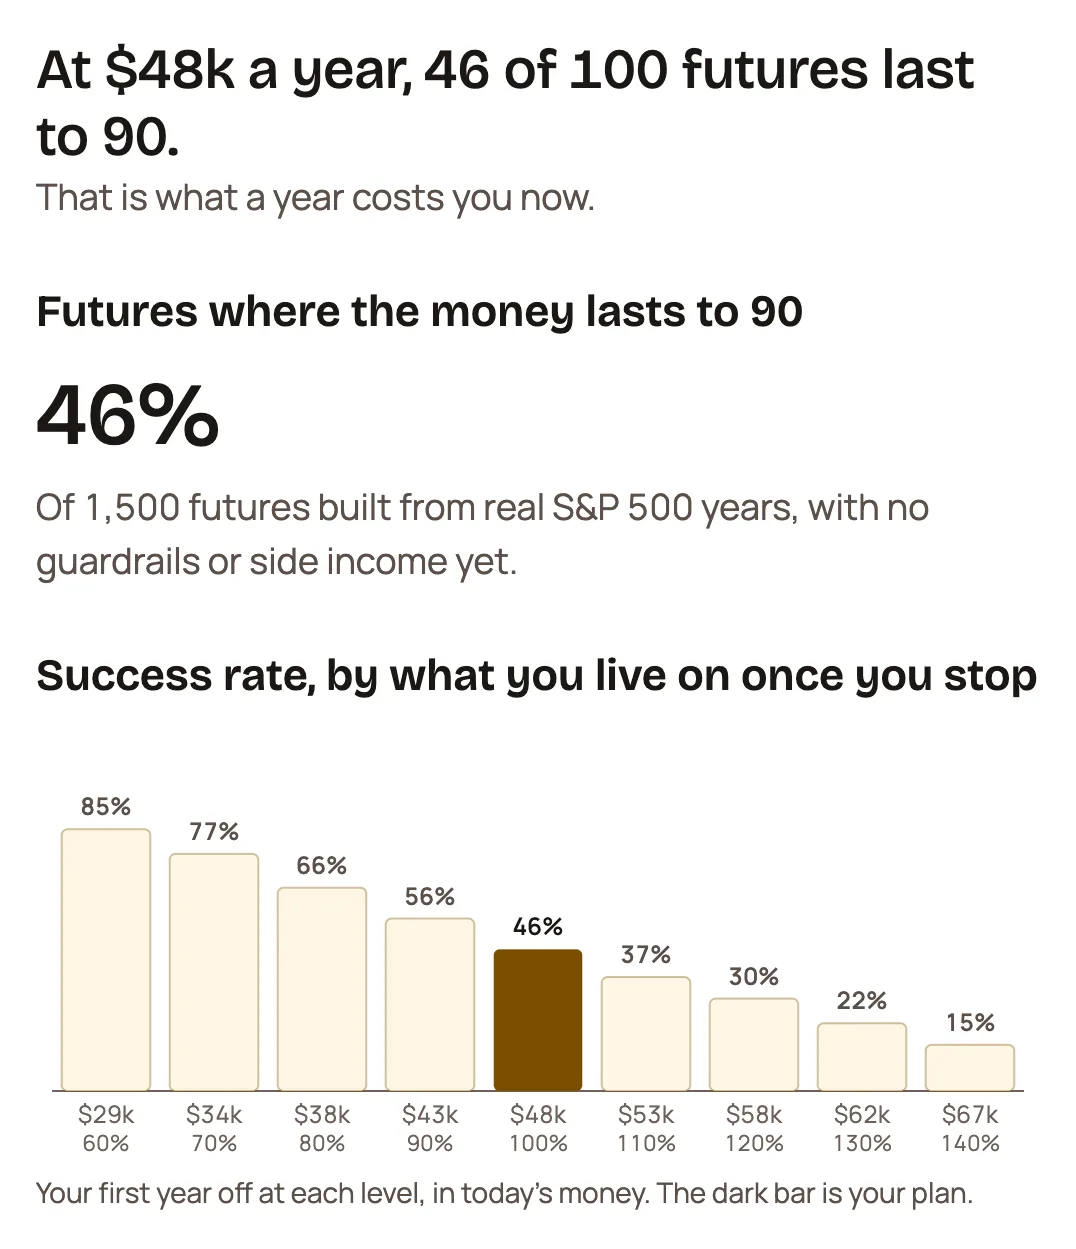
Step 4 of the planner on Sam's plan. If Sam spends the same amount every year, adjusted for inflation, whatever the market does, the money lasts to 90 in 46% of futures. The bars show what happens at other spending levels.
46% is the honest version of Sam's 25x, and it is worse than even odds. The bars underneath show how sensitive it is to spending. If Sam lived on 90% of that budget, $43,000 a year, the odds rise to 56%, and at 70%, $34,000 a year, they reach 77%. Each 10% of spending is worth roughly 10 points of safety, which is the first clue to what actually fixes this plan.
Step 3: guardrails, which means cutting back in a bad year
Nobody really spends the same amount through a 40% crash. Guardrails turn that instinct into a rule. In the planner's starting rules, after a year in which Sam's investments return less than 2%, Sam cuts the discretionary costs by 20% for the next year, and after a year they return more than 20%, Sam raises them by 10%. A cut stays in place until a good year gives it back.
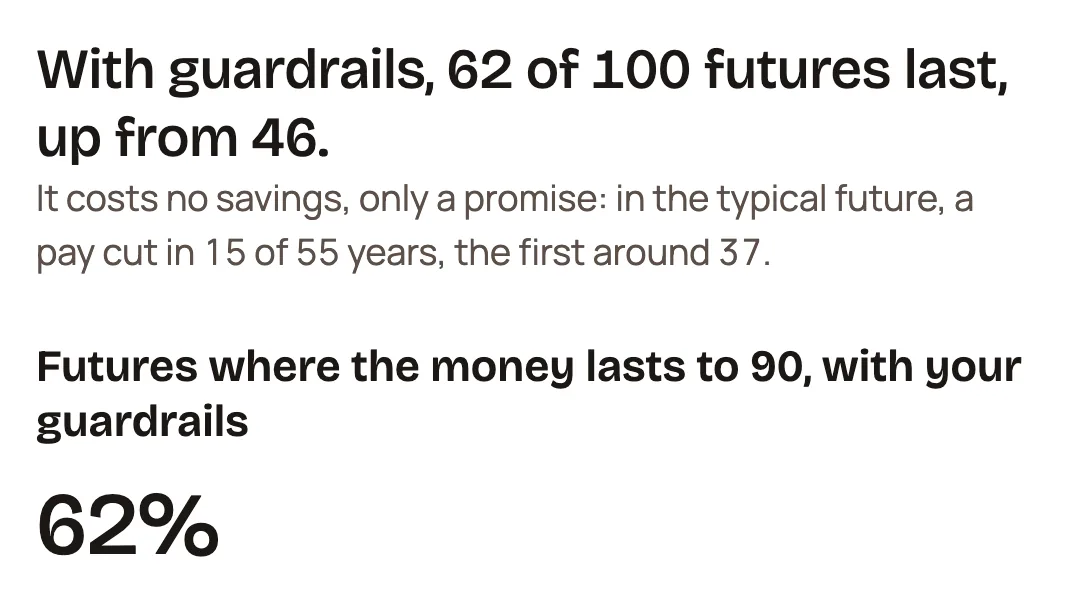
Step 5 with the starting guardrails. The plan goes from 46% to 62%, and the price is a smaller travel and fun budget in about 15 of Sam's 55 years.
That is 16 points for free, because it costs no savings at all, only a promise to spend a little less in a bad year. But notice that it stops at 62%. Sam's discretionary costs are only $1,050 of the $4,000, so even cutting them hard cannot move the plan very far. I will come back to that, because it turns out to be the most important thing in this whole article.
Step 4: a little income, early and late
Now give Sam two pieces of income that are very common in real early retirements. The first is $1,500 a month of part time work for the first 10 years, from 35 to 45, which is a few days a week of consulting, tutoring or whatever Sam actually enjoys. The second is $2,000 a month of Social Security from 67, in today's money.
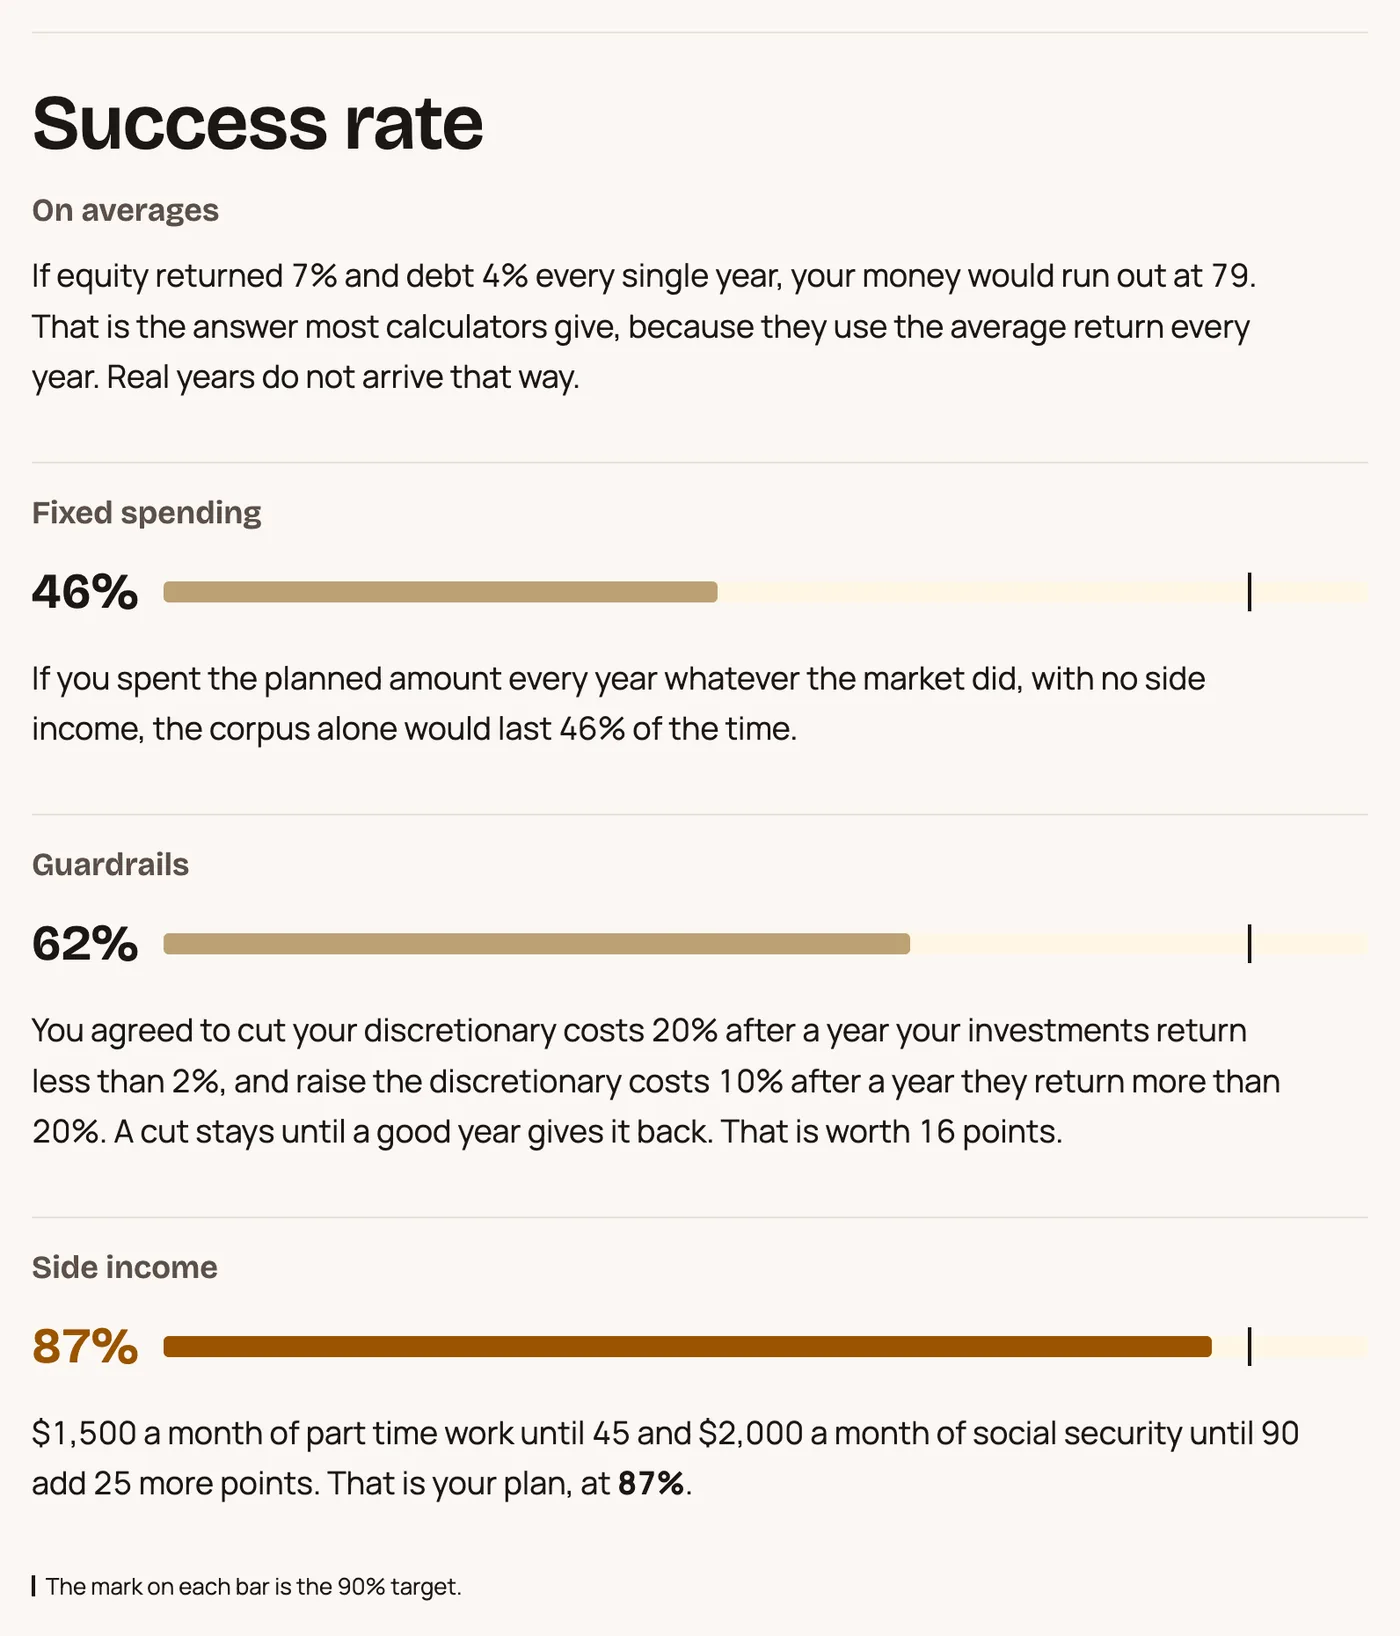
The report's success rate section on Sam's full plan, showing every step at once. The mark on each bar is the planner's 90% target.
With both of those, Sam's 25x lasts to 90 in 87% of futures, just short of the 90% the planner aims for. The early income matters more than its size suggests, because it protects the portfolio in exactly the years when a crash does the most damage. The late income matters because it shrinks what the portfolio has to pay for during the last 23 years. Neither of them requires a single extra dollar of savings.
What actually decides whether 25x is enough
Sam is one person with one set of assumptions. Real retirement planning depends on many more variables than a multiple, so I changed them one at a time and reran all 1,500 futures each time. Every figure below is the share of futures where the money lasts to 90, first with fixed spending and then with the starting guardrails.
How long the money has to last
| Retire at | Years to 90 | At 7% stocks, fixed | At 7%, guardrails | At 10% stocks, fixed | At 10%, guardrails |
|---|---|---|---|---|---|
| 35 | 55 | 46% | 62% | 78% | 88% |
| 45 | 45 | 56% | 70% | 82% | 90% |
| 55 | 35 | 69% | 81% | 88% | 94% |
| 60 | 30 | 78% | 87% | 92% | 96% |
| 65 | 25 | 86% | 93% | 95% | 98% |
This table is the whole story of the 4% rule in one place. 25x for a 30 year retirement holds up well even on the cautious assumptions, and if stocks return anything close to their history, it clears 90% on its own. Stretch the same multiple to 55 years and it depends heavily on what the market does and on whether you are willing to bend.
What you assume stocks will return
| Stocks, before inflation | Fixed | Guardrails |
|---|---|---|
| 6% | 35% | 50% |
| 7% (the planner's default) | 46% | 62% |
| 8% | 58% | 73% |
| 9% | 69% | 81% |
| 10% (the S&P 500 since 1928) | 78% | 88% |
Every point of return you assume is worth about 10 points of safety, which is why two people with identical plans can get wildly different answers from different calculators. If a tool tells you 25x is safe for 50 years, check what return it assumed before you believe it.
Inflation
| Inflation a year | Fixed | Guardrails |
|---|---|---|
| 2% | 64% | 78% |
| 2.5% | 56% | 70% |
| 3% | 46% | 62% |
| 3.5% | 37% | 53% |
| 4% | 30% | 42% |
| 5% | 15% | 25% |
Inflation is the quiet one. Going from 3% to 4% costs Sam 16 to 20 points, and at 5% the plan is close to hopeless. Your own inflation matters as much as the official number, too. If Sam's health costs rise at 5% a year instead of 3%, the guardrails plan drops from 62% to 59%, and health is exactly the cost that tends to rise faster as you get older.
The multiple itself
| Multiple | Pot | Fixed | Guardrails |
|---|---|---|---|
| 20x | $960,000 | 26% | 38% |
| 25x | $1,200,000 | 46% | 62% |
| 28x | $1,344,000 | 57% | 72% |
| 30x | $1,440,000 | 64% | 77% |
| 33x | $1,584,000 | 71% | 83% |
| 40x | $1,920,000 | 83% | 91% |
On cautious assumptions, saving your way to safety is expensive. Getting from 62% to 90% through savings alone takes about 40x, which is $720,000 more than Sam has, or many more years of work. The next table shows a much cheaper route.
How much of your spending can actually bend
| What Sam is willing to cut after a bad year | Success rate |
|---|---|
| 10% of discretionary costs | 54% |
| 20% of discretionary costs | 62% |
| 50% of discretionary costs | 68% |
| All discretionary costs | 71% |
| 30% of discretionary and 5% of essentials | 89% |
| 50% of discretionary and 10% of essentials | 95% |
This is the most important table in the article. Cutting only the fun stuff stops helping quickly, because it is only a quarter of Sam's budget. The moment Sam is also willing to trim essentials by 5% in a bad year, for example by moving somewhere slightly cheaper or switching to a cheaper health plan for a while, the plan jumps to 89%. A plan where half of the spending is discretionary behaves the same way: with the starting guardrails it lasts 79% of the time, and with 50% cuts it reaches 89%. Flexibility is worth more than a bigger pot.
Life, which rarely stays as simple as Sam's
Sam has no dependents and no big costs coming. Add a child of 3, with $800 a month of costs until 22 and $120,000 of college at 53, and the guardrails plan falls from 62% to 42%. Add a new roof and a car, $40,000 each at 45 and 55, and it falls to 57%. Any FIRE number that does not know about the people who depend on you and the big costs you can already see coming is a number for somebody else.
When 25x really is enough
So here is the person for whom 25x works, meaning the planner puts their money at 90% or better to last until 90.
You retire at 60 or later. With 30 years or less to fund, 25x with guardrails reaches 87% even on cautious assumptions, 100% once Social Security arrives, and 92% with fixed spending if stocks do what they have historically done.
You retire early, and three things are true at once. You are willing to cut your spending after a bad year, including a small trim to essentials, and you have income arriving later in life, like Social Security, and US stocks deliver something close to their history. Under those conditions Sam's 25x at 35 reaches 93% with the starting guardrails and Social Security. Even on the cautious 7%, it reaches 97% if Sam's guardrails cut 30% of the discretionary costs and 5% of the essentials after a bad year, with Social Security arriving at 67.
Your spending is genuinely flexible. If half of your budget is discretionary and you would really cut it in half in a bad year, 25x at 35 gets close to 90% before any other income.
Inflation stays tame. With guardrails and Social Security, 25x at 35 stays at 90% or above as long as inflation averages 3.5% or less, assuming historical stock returns. At 4% it slips to 87%.
When 25x is probably not enough
You have children, or parents who depend on you, or big costs you can already see. Those are the costs that turn 62% into 42% before anything else goes wrong.
Most of your spending is fixed. If almost everything you spend is rent, food, health and insurance, guardrails have very little to cut, and Sam's plan with only 10% discretionary costs lasts 52% of the time.
You are planning around 4% inflation or higher. Every extra point of inflation costs 10 to 20 points of safety.
Your money and your life are in India. I ran the same person in rupees, spending ₹12 lakh a year with ₹3 crore, which is 25x, on the planner's Indian defaults of 11% for Nifty, 7% for debt and 6% inflation. It lasted in 58% of futures with fixed spending and 66% with guardrails. It took about 35x, ₹4.2 crore, to reach 93%. The gap between Indian returns and Indian inflation is thinner than most people assume, which I wrote about in detail in will your ₹10 crore survive an AI crash.
So, is 25x enough for you?
25x is a fine starting point, and for some people it is genuinely enough. It is a number built for a 30 year retirement, a calm inflation rate and a person who never changes their spending. If you look like that person, or you have the flexibility and the later income that lift the plan to 90%, you can stop worrying about the multiple.
If you are not that person, and most early retirees are not quite that person, the answer is in the details of your own life: how long your money has to last, what you spend and how much of it can bend, who depends on you, what big costs are coming, and what income will arrive later. This is exactly why I built the planner. One neat 25x was never going to tell me whether I am the Sam at 46% or the Sam at 93%.
Run your own plan through the FIRE planner. It takes your real spending line by line, the people who depend on you, your one off costs, your guardrails and your side income, runs it through the same 1,500 futures, and tells you your success rate and the smallest changes that get you to 90%. If you want to see the history behind all of this, the retirement backtest calculator replays any plan through every real US start year since 1928, and surviving a stock market crash on Lean FIRE explains guardrails in more detail.
How these numbers were made
Every figure in this article comes from the FIRE planner's own engine, the same one that runs on the site. Each of the 1,500 futures is a sequence of real calendar years of the S&P 500 including dividends, from 1928 to 2025, drawn in blocks of 5 years and shifted so that it compounds at the stock return assumed, with the bond part earning its assumed return every year. Spending rises with inflation, each cost at its own rate, and the plan runs to age 90. A plan succeeds if the money never runs out before 90. Social Security and part time income are entered in today's money and rise with inflation. The planner does not yet include taxes or fund fees, and both would lower every number here.
The disclaimer, please actually read it
This article runs a hypothetical person through a planning tool to show how a retirement plan responds to its assumptions. It is general information, and it is not financial, investment or tax advice. I am not a licensed financial advisor, and Sam is not you. Every result depends on assumptions about returns, inflation and spending that nobody can know in advance, the futures are built from past market years that may not resemble the future, and taxes and fees are not included. Please run your own numbers, and talk to a qualified professional before you decide when to stop working.